Machine Learning polygon intersection surface areas
Trying to construct a ‘spatially aware’ AI not only teaches me to work with Keras, but also with Python itself. These few months saw my first real introduction to the language (before I had dabbled in some of it, but not much) and its use of list comprehensions and the pythonic way of doing things. I have also learned a lot about a few fundamental tools and frameworks that make things working with multi-dimensional data a lot more convenient and I’m very impressed with frameworks like Numpy and Matplotlib.
Especially Matplotlib allows me to visualize some of the results I’ve gotten so far. They show to what extent my model architecture of an LSTM wrapped with some Dense layers is able to cope with estimating surface areas for intersecting polygons. The task is to estimate the intersection surface area in square meter for two intersecting polygons. Some interesting facts:
Intersection surface area mean:
33.87 m2
Intersecting error mean:
9.06 m2
This means that on average, a surface estimation is still 27% off from the average intersection surface area. This is a huge error. But: it’s also a percentage from a model that learned over just a couple of minutes. This isn’t a very helpful statistic, as it says nothing about the distribution of error over the examples. But still.
On the bright side: from a training set of roughly 100k examples, I can now show plots of the training examples it is good at predicting, an which ones are hard. I do this by leveraging basic properties of Shapely geometries on pyplot operations:
from matplotlib.collections import PatchCollection
from shapely import wkt
from matplotlib import pyplot as plt
from matplotlib.patches import Polygon


def wkt2pyplot(input_wkts, target_wkts=None, target_color='red'):
    """
    .... there's some more stuff in between, but for conciseness
    """
    # TODO: handle other types of geometries
    # TODO: handle holes in polygons (donuts)
    fig, ax = plt.subplots()

    if target_wkts:
        target_geoms = [wkt.loads(target_wkt) for target_wkt in target_wkts]
        for geom in target_geoms:
            if geom.type == 'Point':
                plt.plot(geom.coords.xy[0][0], geom.coords.xy[1][0],
                         marker='o', color=target_color, linewidth=0)
            elif geom.type == 'Polygon':
                collection = PatchCollection(
                    [Polygon(geom.boundary.coords)],
                    alpha=0.4, linewidth=1)
                collection.set_color(target_color)
                ax.add_collection(collection)
Good results
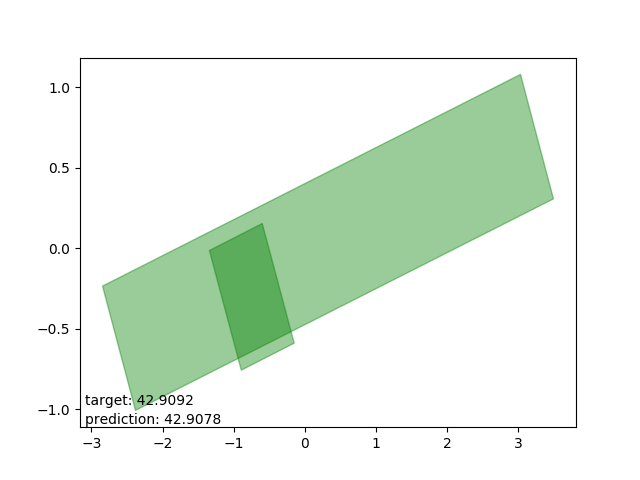
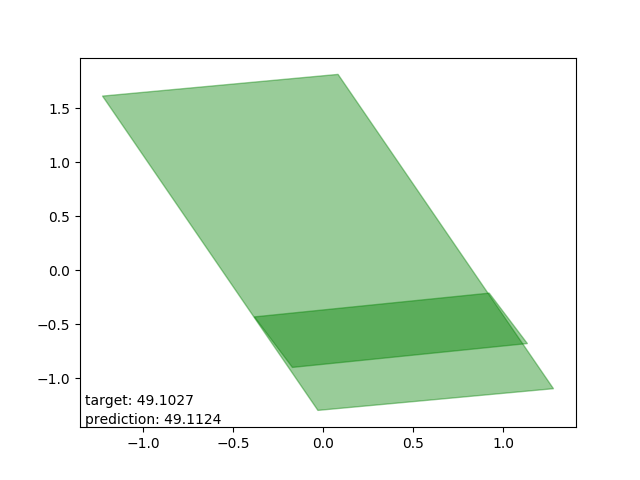
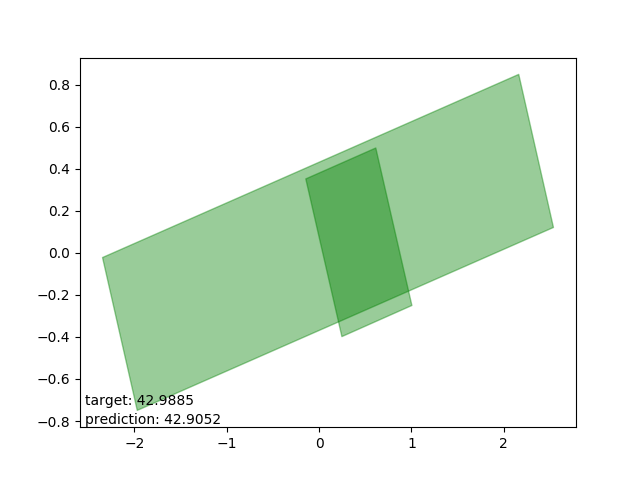
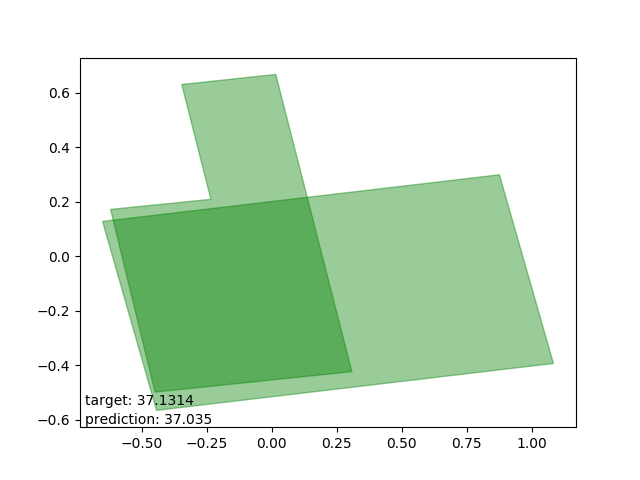
Very nice. Results with accuracies in centimeters, or decimeters at worst.
Now for the failure cases…
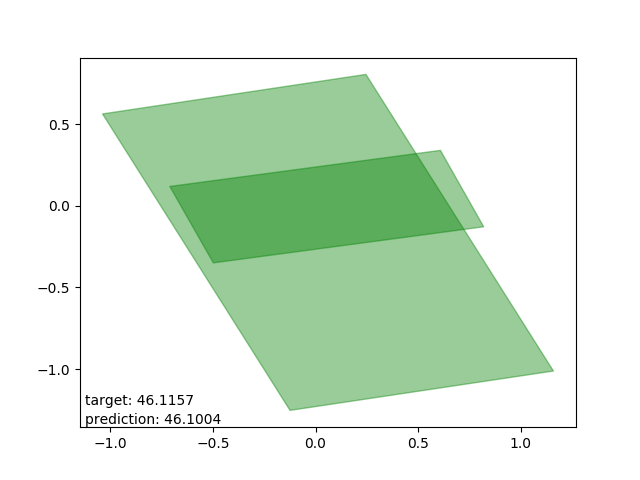
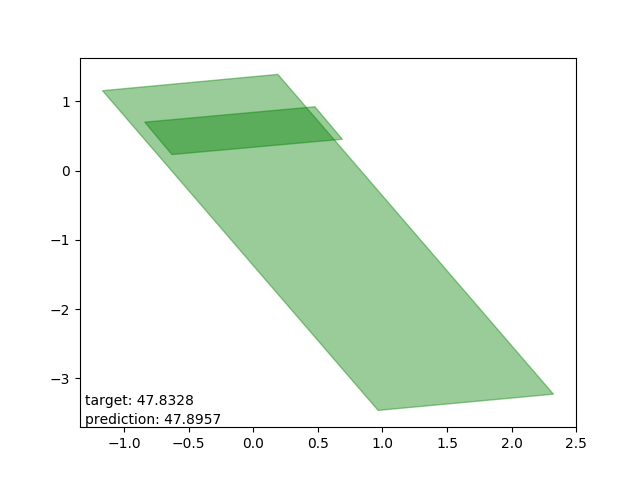
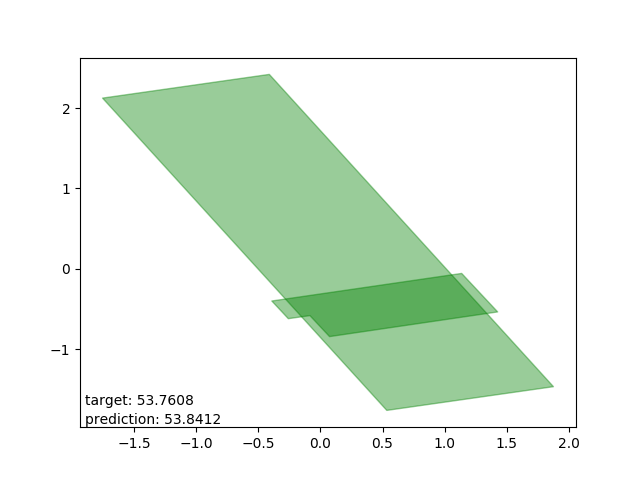
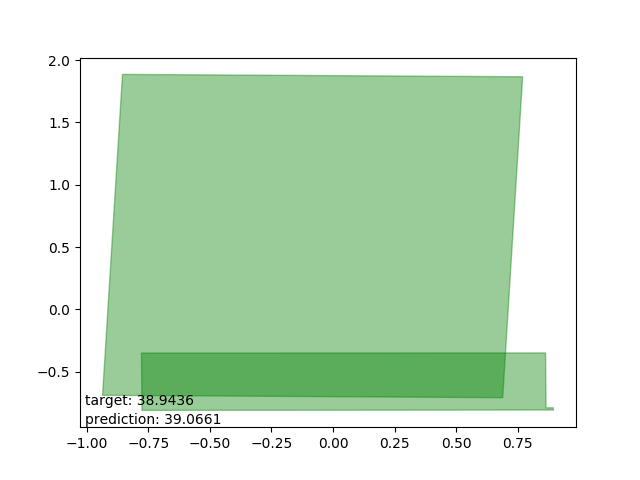
Bad results: estimations too high
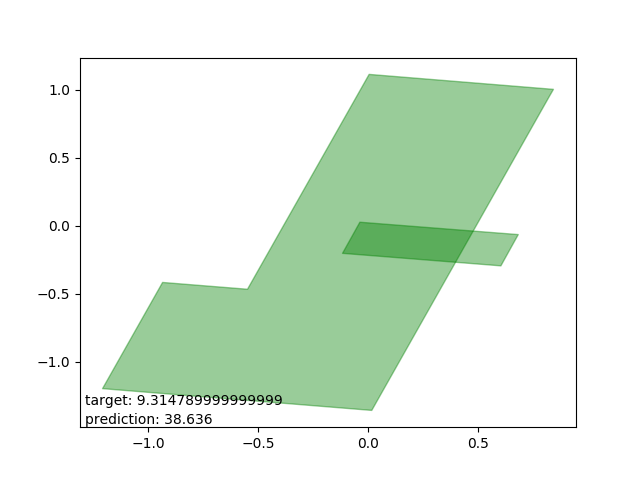
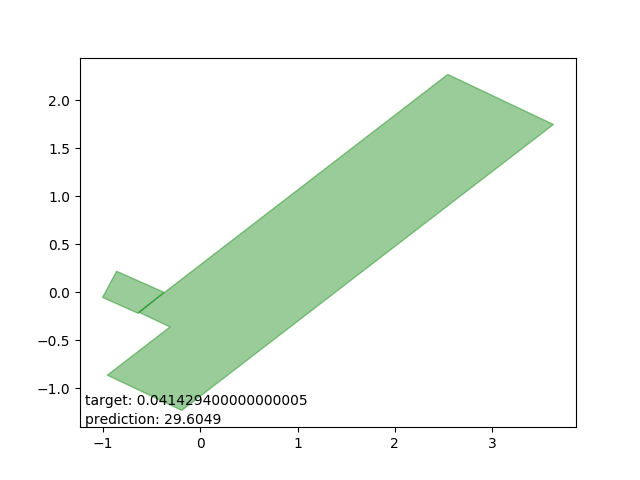
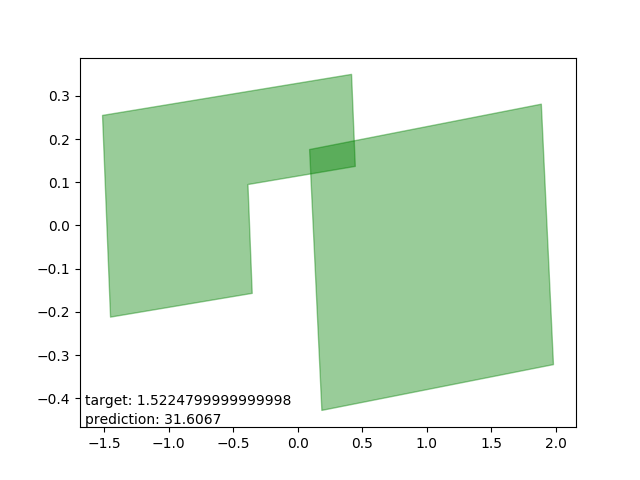
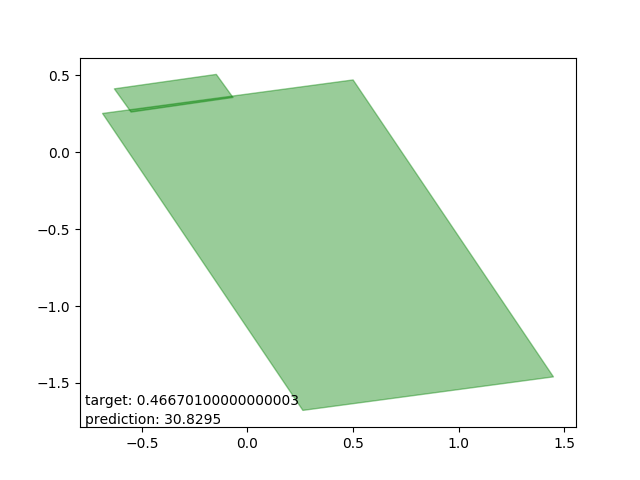
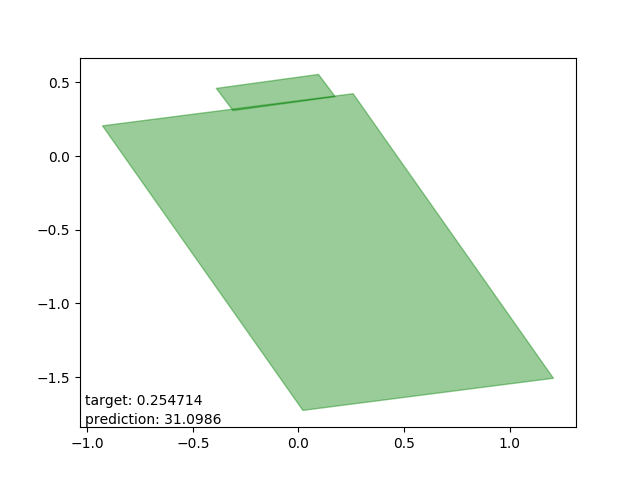
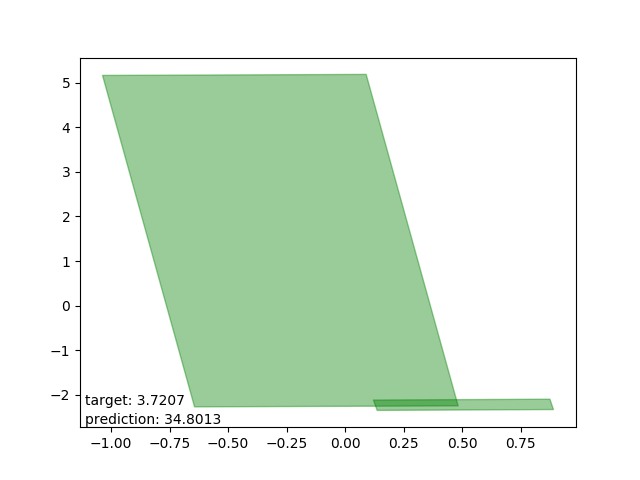
These are intersections where the estimator either (as I can only conjecture) expected one polygon to be entirely within the other. The estimations are all very close to the average intersection.
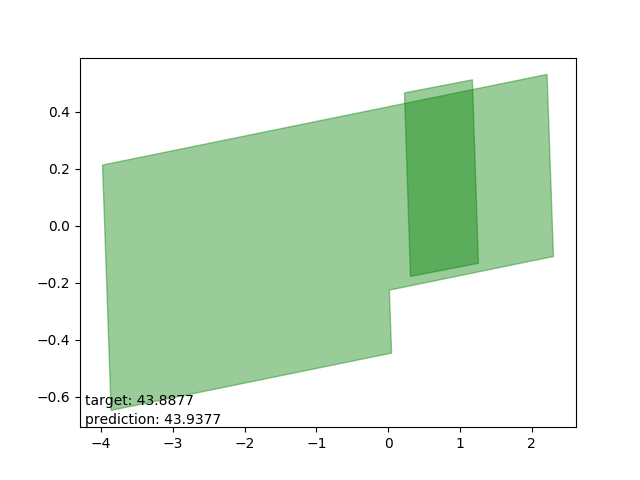
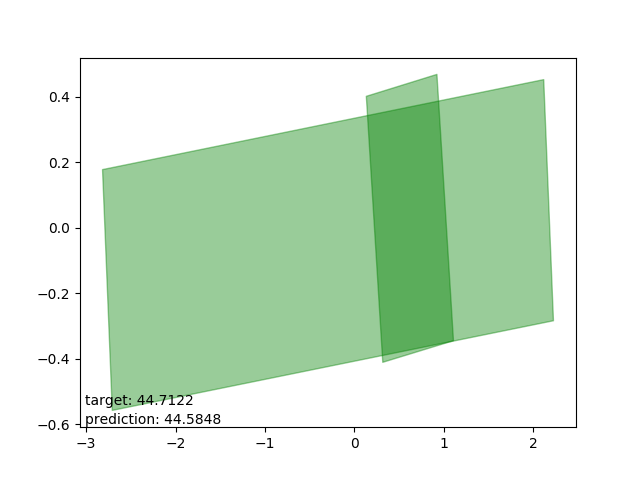
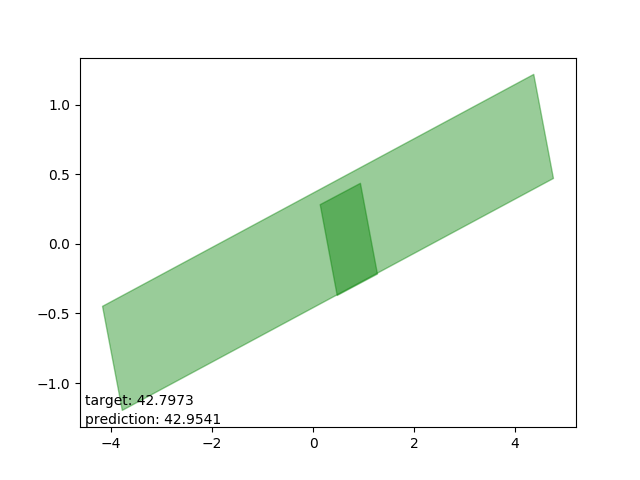
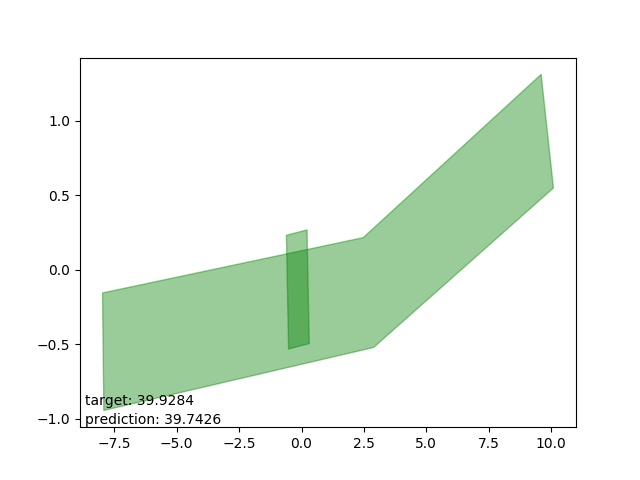
Bad results: estimations too low

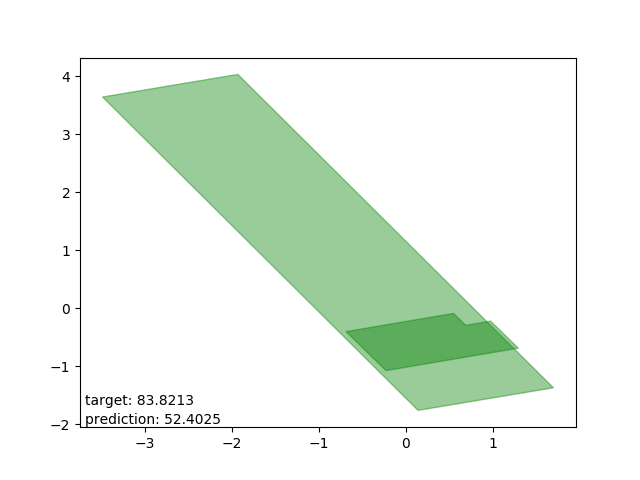
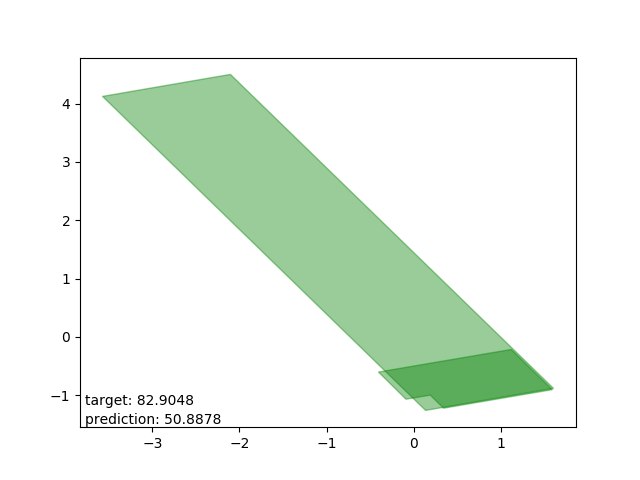
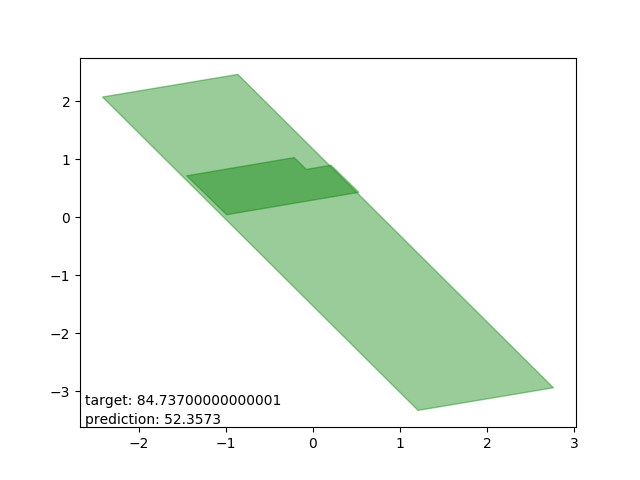
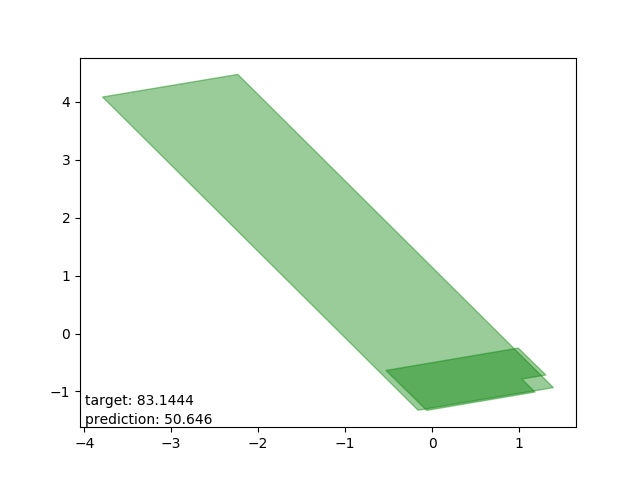
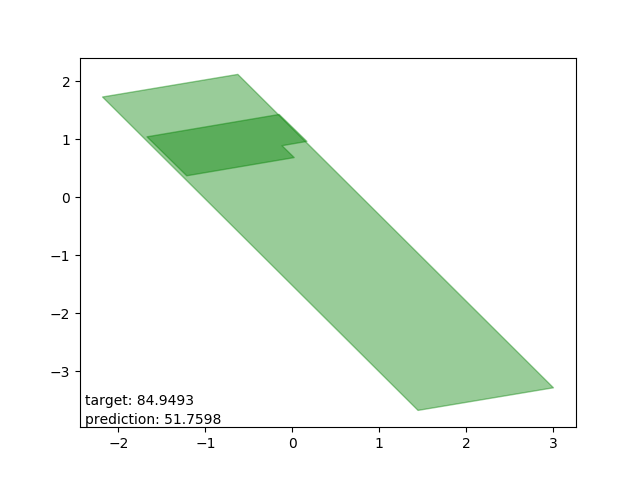
Very interesting: all cases drawn from the same polygon intersection with another, the second one entirely within the first. The target is way beyond the mean.
Possible solution
I’ve been trying to get some gaussian mixture models parameter output working on this, but I’m still trying to get it stable and producing meaningful results (i.e. that don’t settle on means and sigmas of 0). That’s for another post.